Hello everyone!
It's been a while since our last update. The web UI is now ready for testing, and we would love your feedback!
In this comment, I'll explain how to use the web UI. In the next comment, I'll go into the technical details with diagrams for those interested.
Starting and Connecting to the Web UI
The web UI can be found under the Quality and Coordination tab.
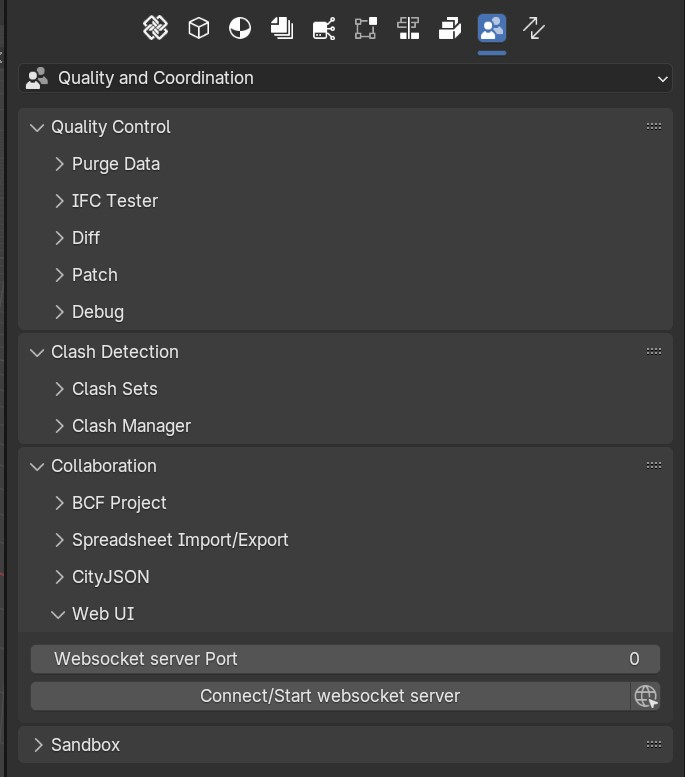
To start the web UI, enter a port number in the WebSocket Server Port field, then click the Connect/Start Websocket Server button. You can also keep the default value 0, and Blender will automatically assign a free port number.
Multiple BlenderBIM instances can connect to the same web UI by specifying the same port number in all of them.
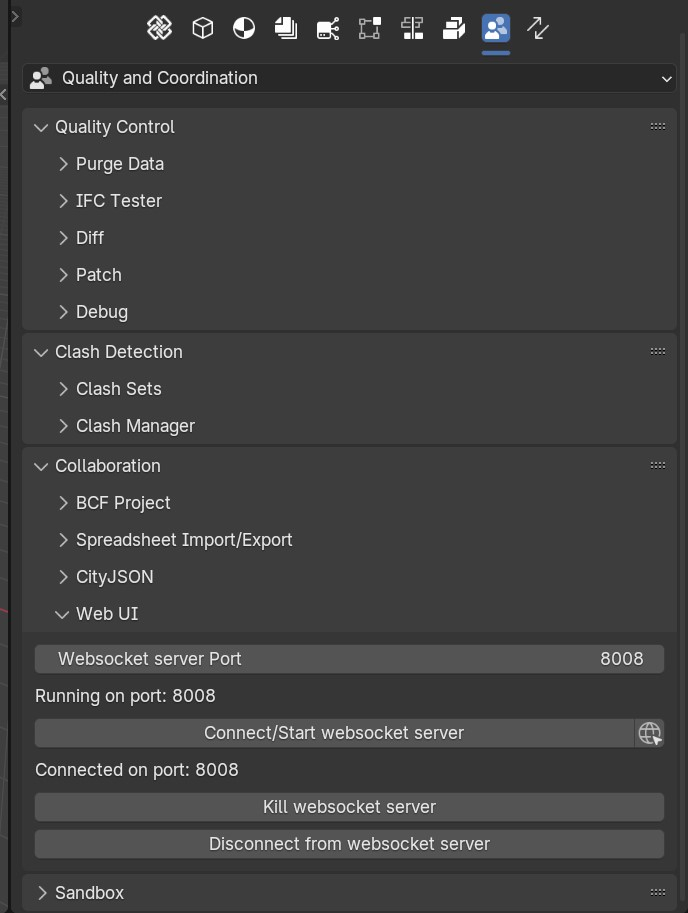
Once started, you can:
Web UI Components
After starting the web UI, a browser tab will open.
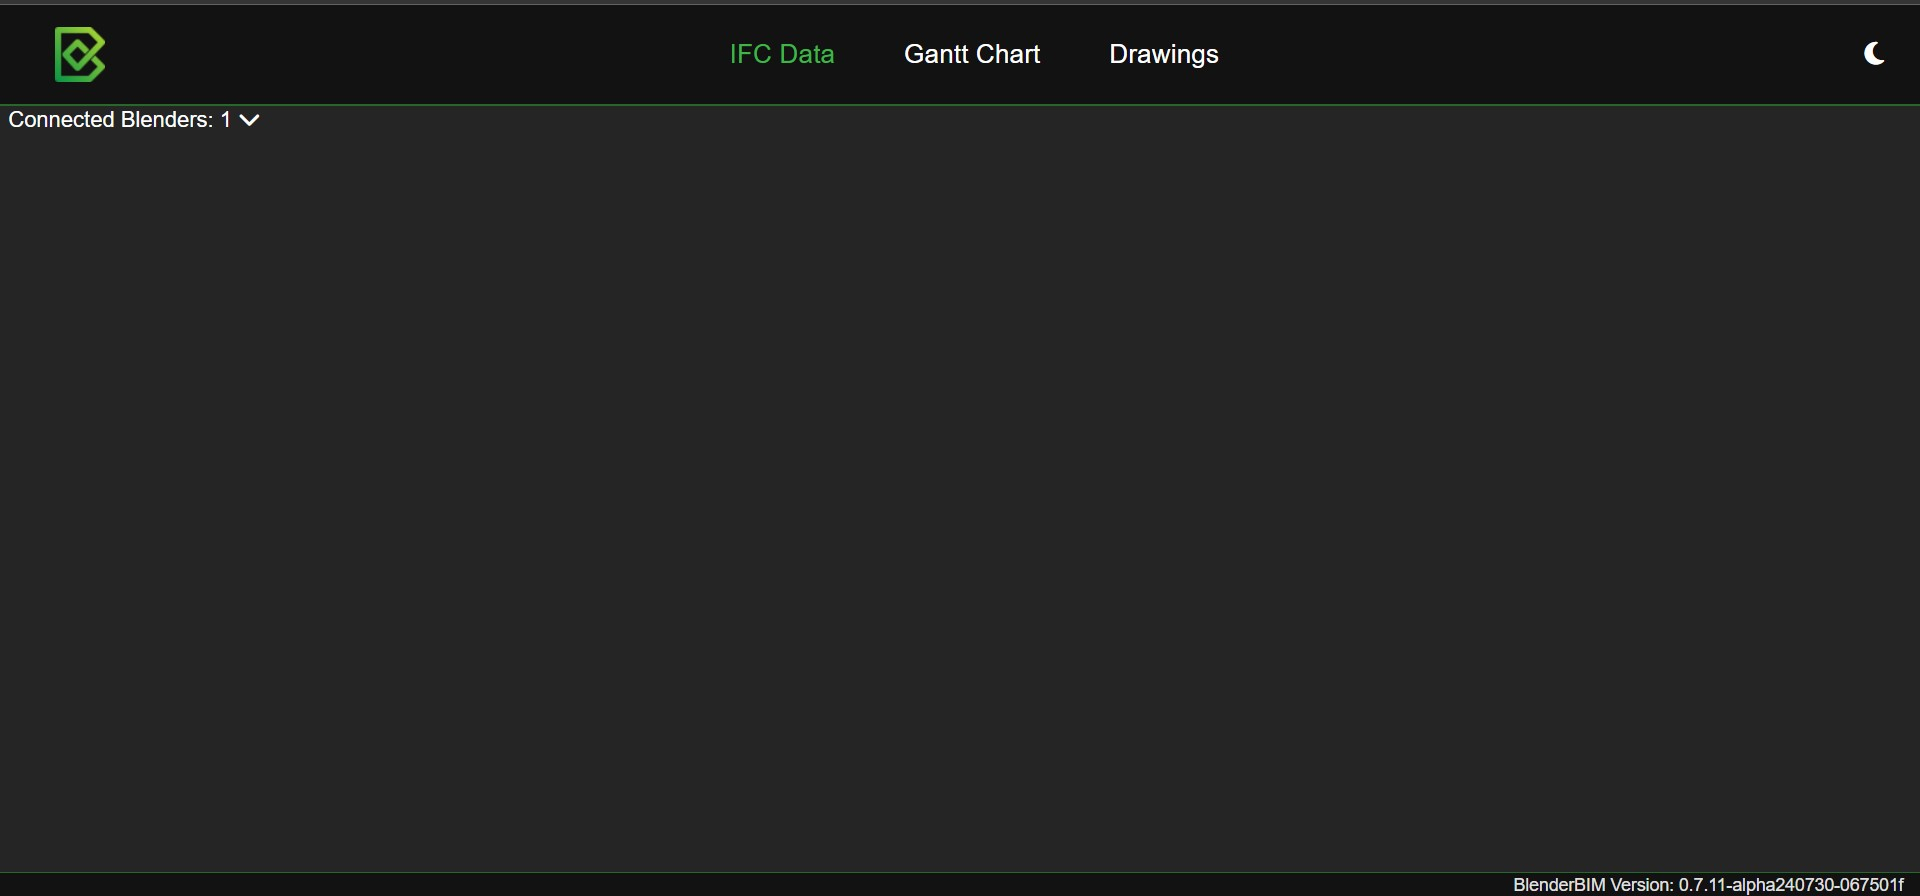
The web UI includes:
-
Navigation Bar: Switch between different pages.
-
Connected Blenders Counter: Shows the number of connected BlenderBIM instances with details. (Currently partially working, full functionality expected next week.)
-
Main Container: Displays data for the current page.
There are three pages in the web UI:
-
IFC Data Page: Displays tabular data for exported IFC data.
-
Gantt Chart Page: Shows Gantt charts for work schedules.
-
Drawings Page: Displays drawings/sheets saved in the IFC file.
Note: Page names might be updated to reflect their functionalities better.
IFC Data Page
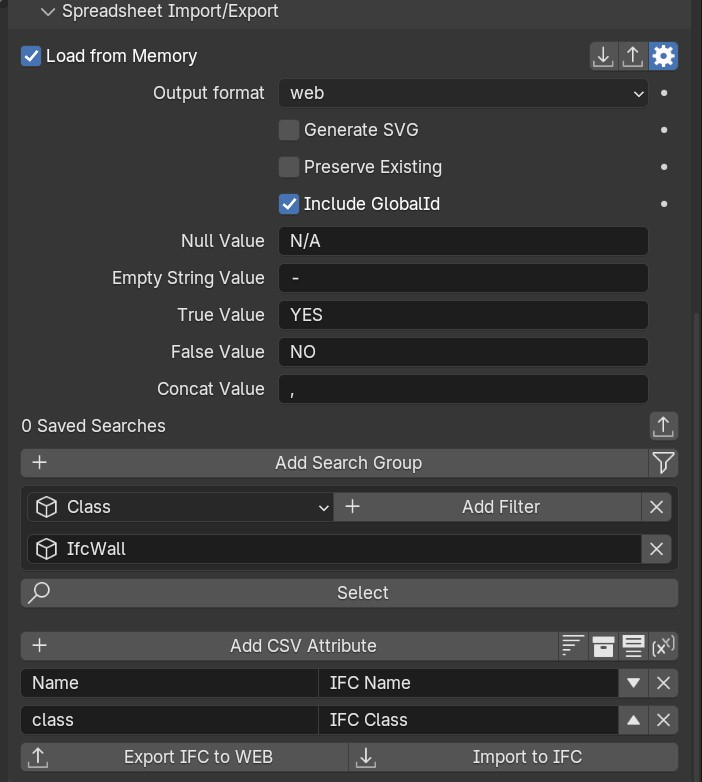
The IFC data page shows tabular data for the exported IFC data. This IFC data is exported from the Spreadsheet Import/Export Panel in BlenderBIM
To export data to the web UI:
-
Go to the Spreadsheet Import/Export Panel.
-
Select the web UI output format.
-
Specify the search group and CSV attribute.
-
Click on Export IFC to WEB.
Note: If the BlenderBIM instance is not connected to a web UI, pressing Export IFC to WEB will start the web UI and export the data.
If multiple instances of the BlenderBIM export data then there will be multiple tables in the web UI.
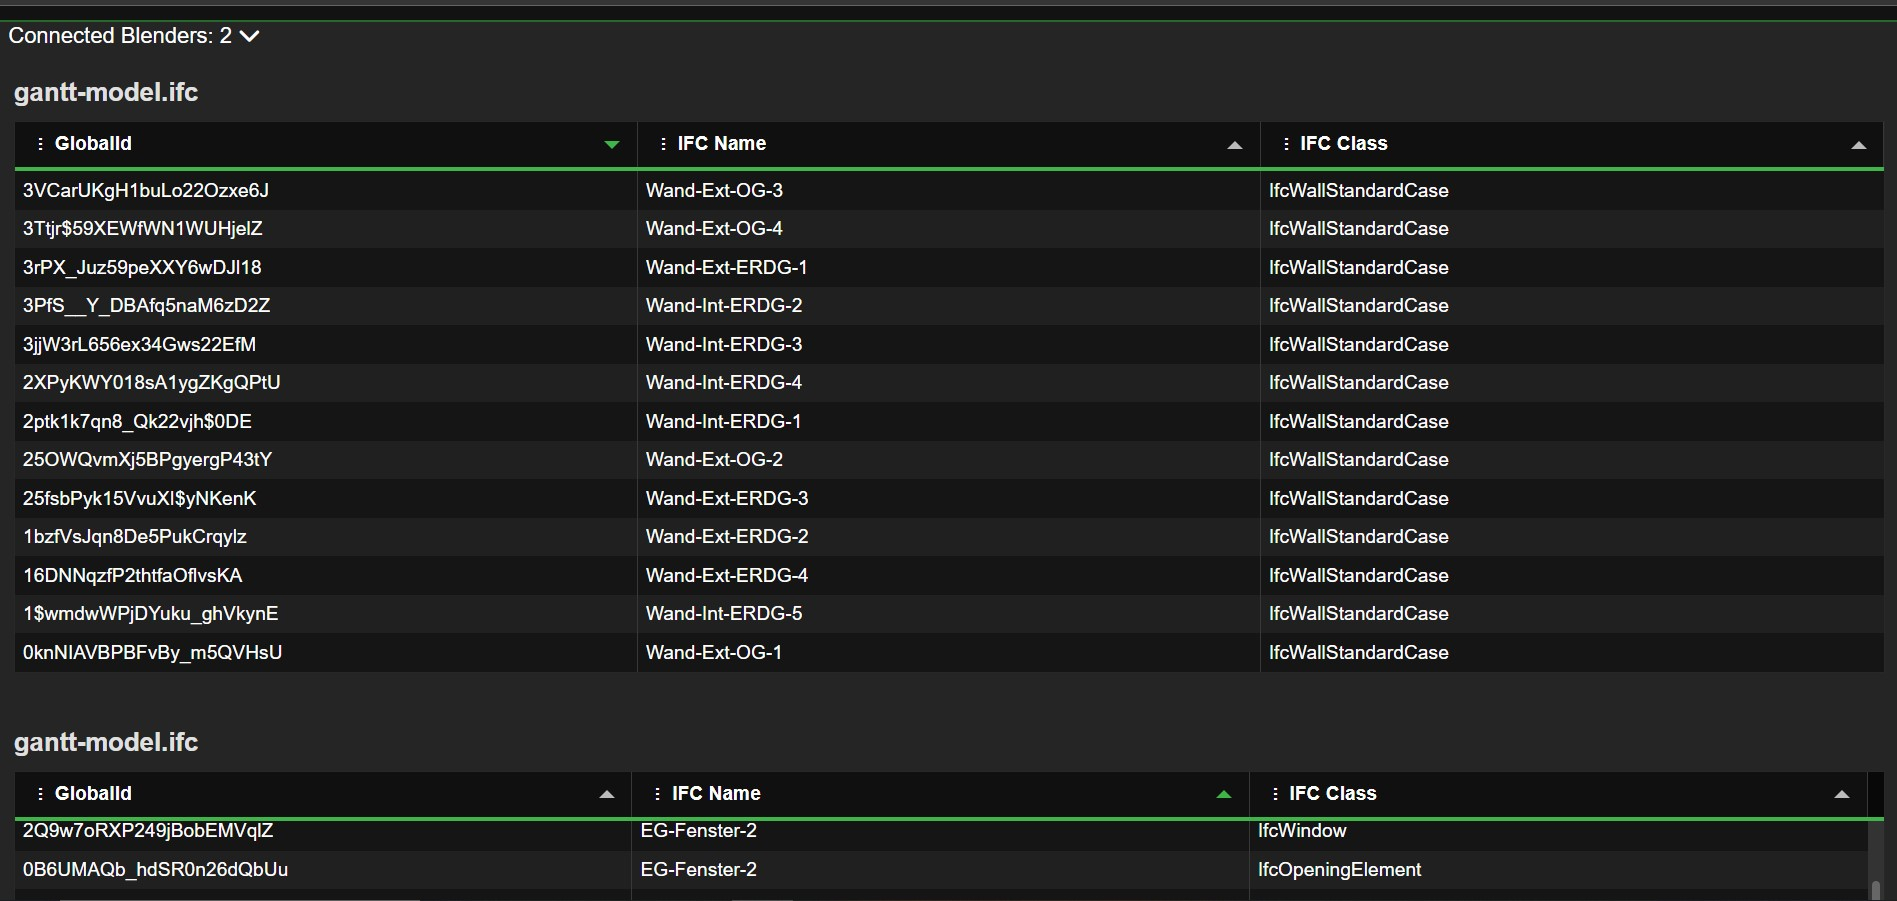
The table in the web UI allows you to:
-
Sort data by clicking on a header.
-
Show/hide specific headers by clicking the dots next to the header names.
-
Highlight objects in Blender by clicking on a row.
Note: If the global ID is not included while exporting data, highlighting will not be available.
If data changes in BlenderBIM, re-export it to update the web UI.
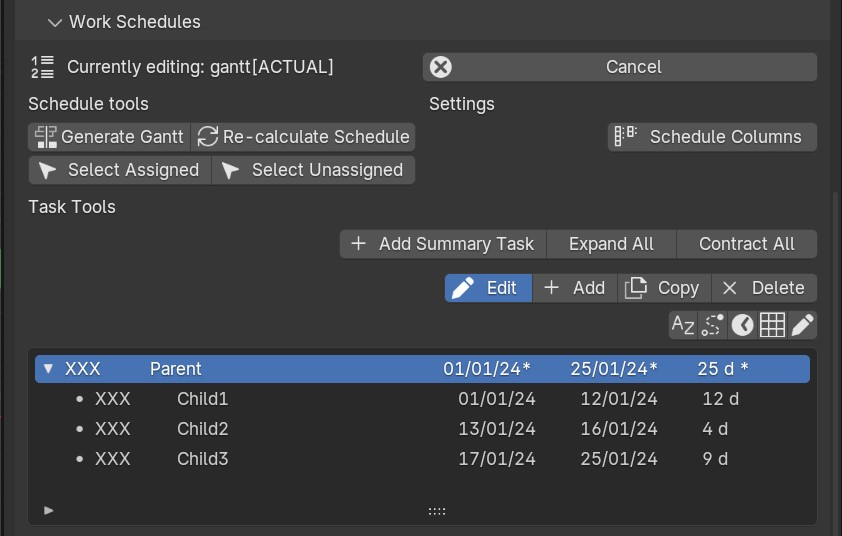
Gantt Chart Page
The Gantt chart page shows the work schedules Gantt charts. Once you have set up a work schedule gantt chart and connected to a web UI then press Generate Gantt to display it in the web UI.
To display a Gantt chart:
-
Set up a work schedule in BlenderBIM.
-
Connect to the web UI.
-
Click Generate Gantt.
Once the Gantt chart is generated, you will see the Gantt chart in the web UI.
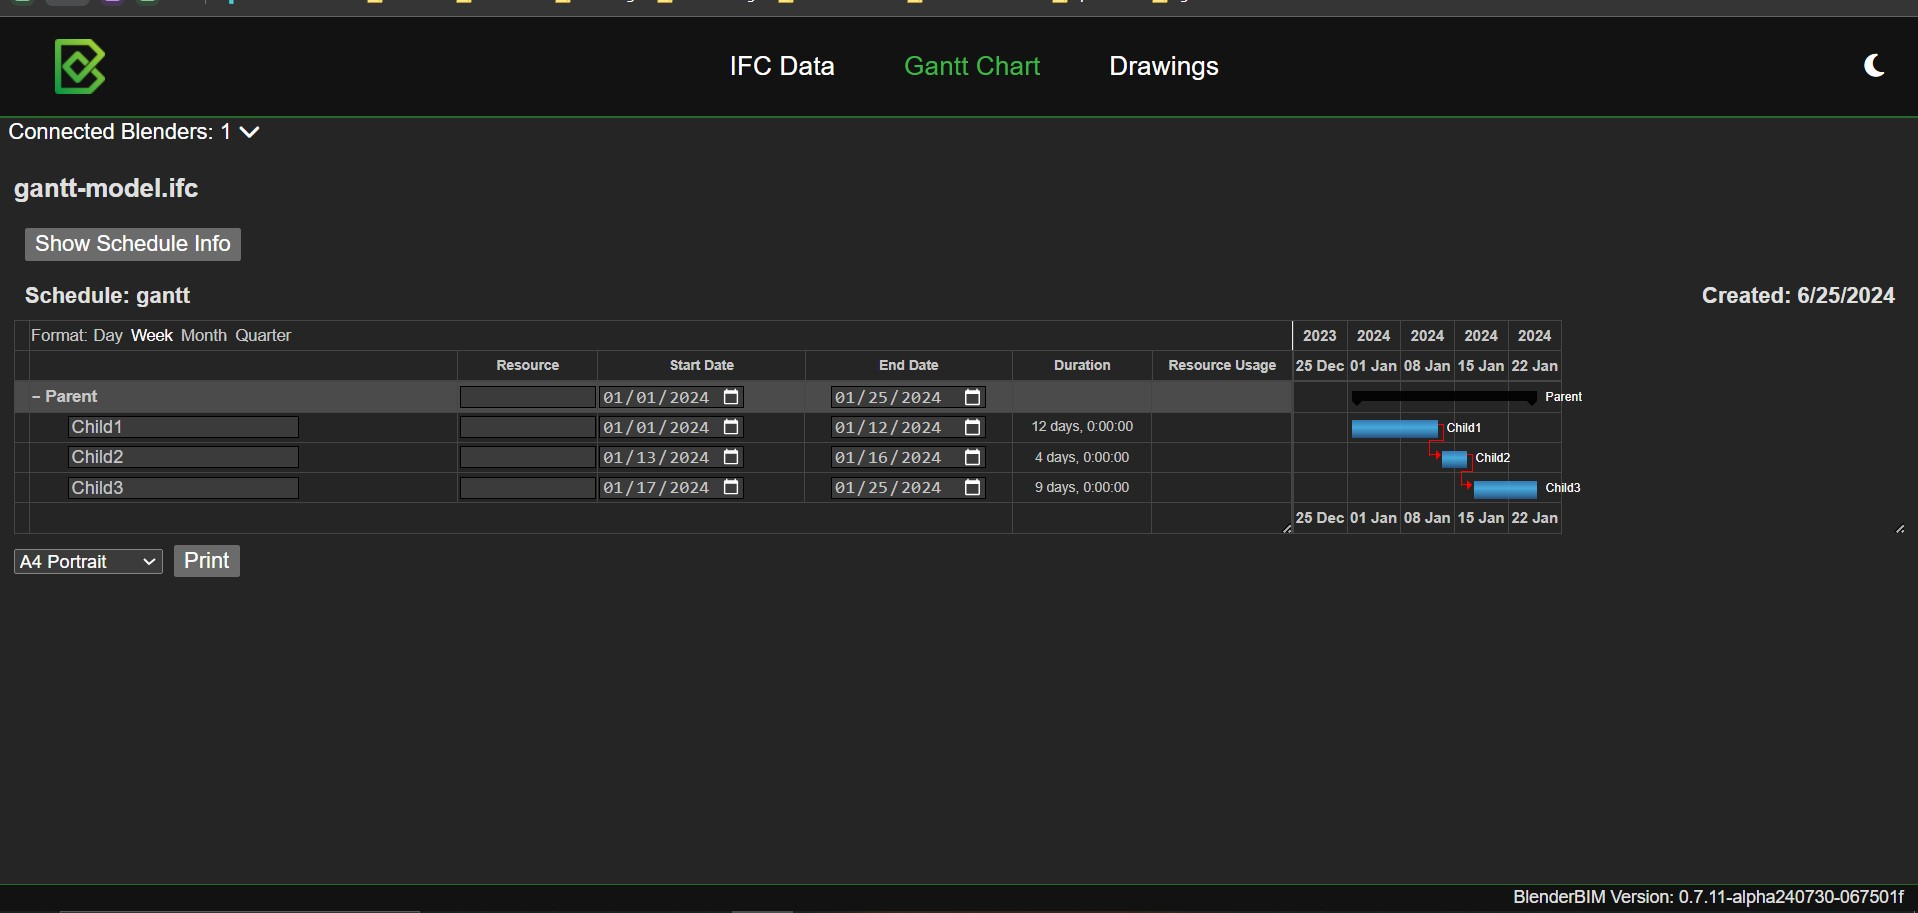
You can edit task names and start/end dates directly in the web UI. Updates will be reflected in both the web UI and BlenderBIM.
Note: If tasks are updated in BlenderBIM, re-generate the Gantt chart to refresh the Gantt chart on the web UI.
If multiple instances of the BB generate Gantt charts then there will be multiple Gantt charts in the web UI.
Drawings Page
The drawings page shows the drawings and sheets that you have created. Once the page is opened, it will show a dropdown menu of the IFC files, from which you can select a specific IFC file to view the drawings and sheets.
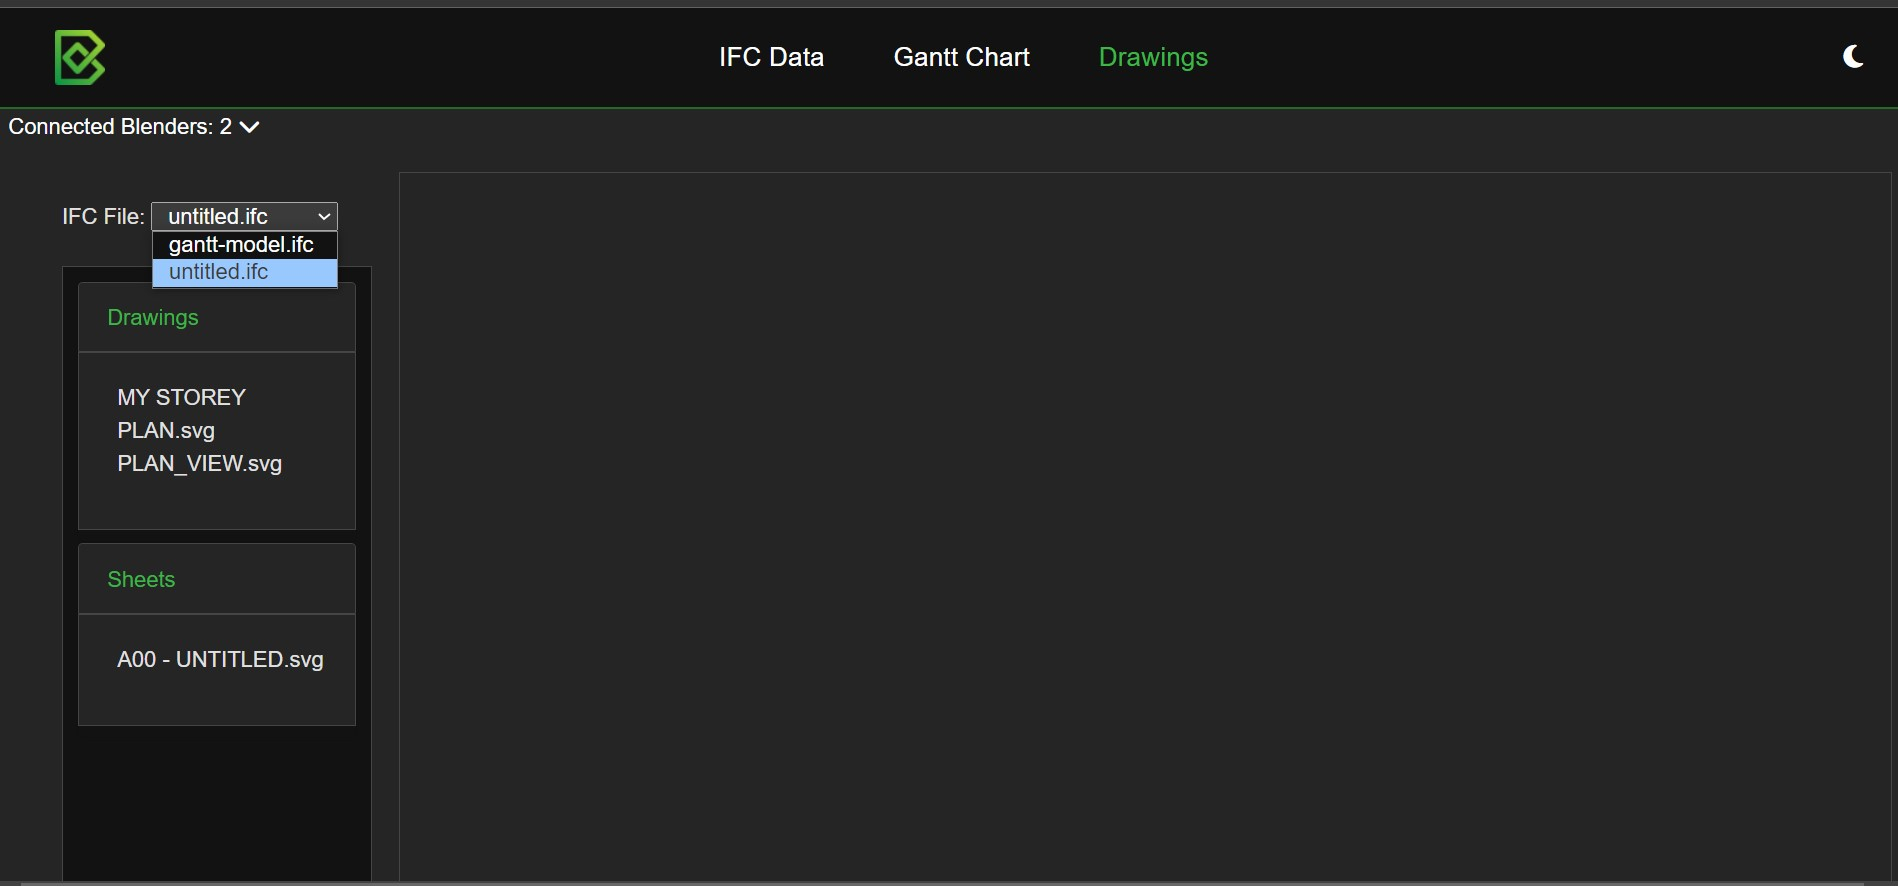
Once a file is selected, the side panels will show the drawings and sheets from which you can select one to view it in the web UI.
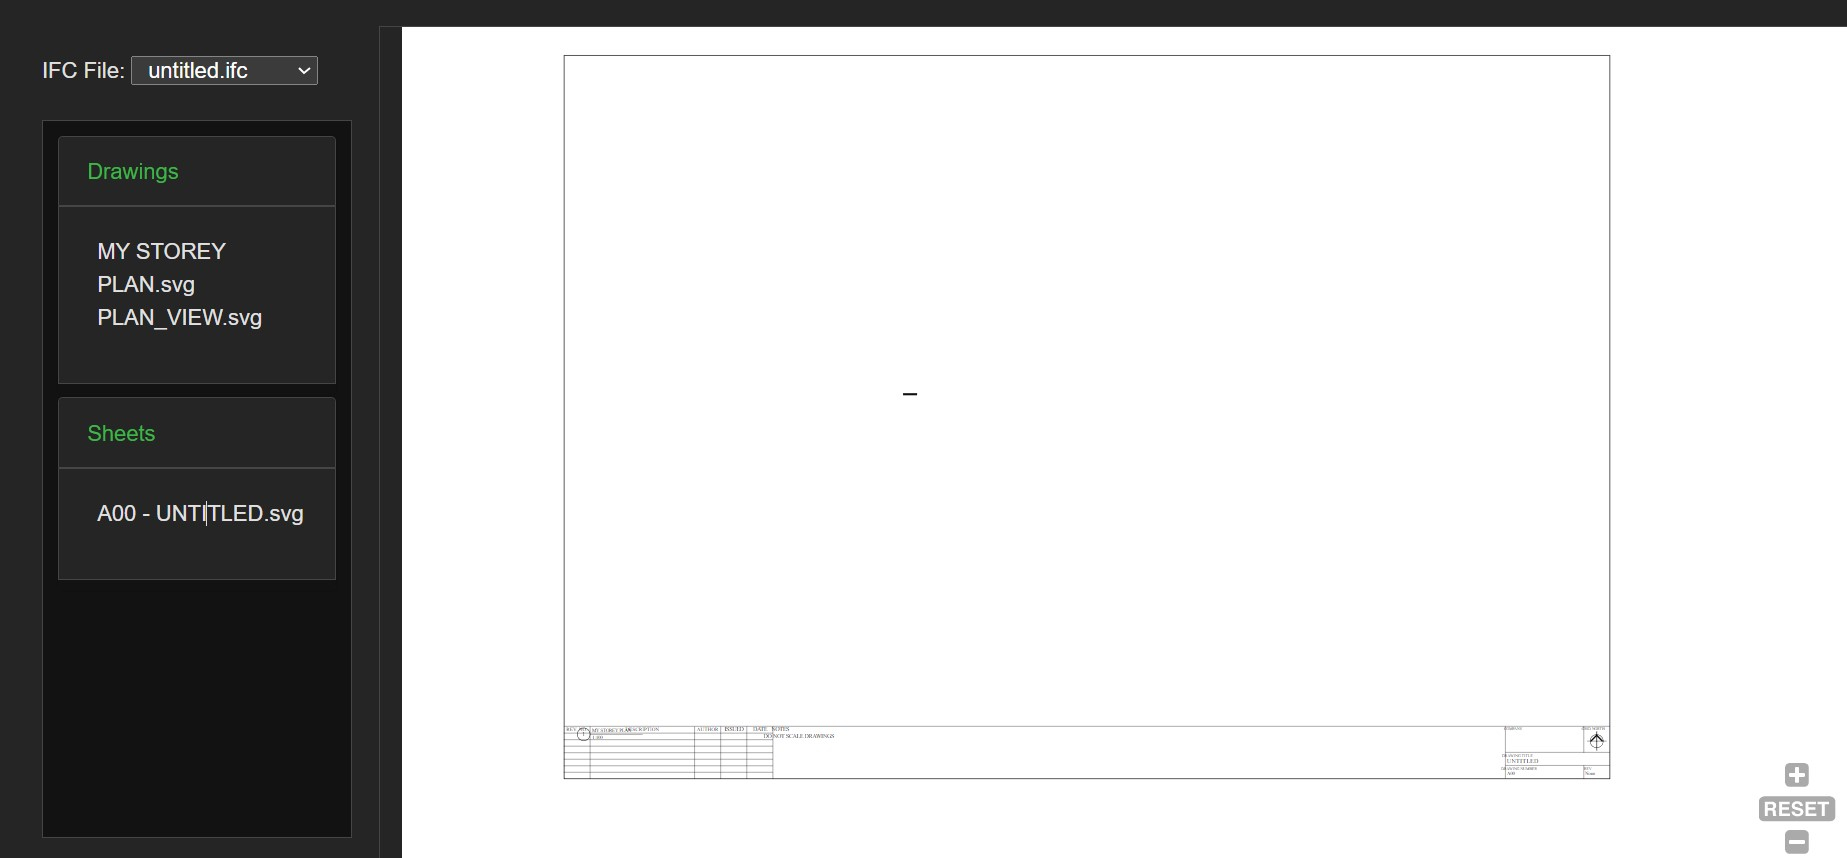
Note: To refresh the drawings/sheets shown, refresh the page. This functionality is currently being improved.
That covers the current functionalities of the web UI. I'd like for everyone to help in testing it and give any feedback!
In the next comment, I'll explain the technical aspects with diagrams.


